In plain language
Companion to RESULTS - Integrated Behavioral Funding.md. This drill settled an argument the program was having with itself: two earlier models had given wildly different answers for what the safety net costs. It turned out they were both right — about two different heights of the same net.
The argument: is the floor cheap insurance or a huge program?
One family of models said EDEN's floor costs almost nothing — a rounding error, self-funded out of the system's normal flows. Another said it's a massive redistribution needing a ~40% tax. Same design, same team, tenfold difference. Someone was wrong, or something was being hidden.
This drill put both in one economy with one honest definition of "essentials," then slid that definition up and down to see what happens.
The answer: it all depends where you hang the net
The cost of the floor turns out to ride almost entirely on one number: how high "basic essentials" sits compared to a typical person's income.
- Hang the net low (essentials ≈ a tenth of typical income): almost nobody needs it, it costs ~0.2% of new money, pays for itself easily. Cheap insurance.
- Hang it at a quarter of typical income: 15–30% of people draw on it, costs ~2.2%, still self-funding. Still insurance.
- Hang it at full typical income: most people draw on it, and it costs 34–40% of new money — a genuine, large transfer program.
Both earlier models were telling the truth about their own rung of the same ladder. The honest conclusion the drill forced: the design can't promise a single cost number, because the cost depends on real-world prices nobody knows before launch. So the spec now carries the whole curve and a boundary — the floor pays for itself as long as essentials cost less than about half a typical income — instead of a single reassuring figure that would only be true at one rung.
The bonus finding: don't build the net with a trapdoor
The drill also caught a flaw in the old floor design. The original rule topped everyone up to the floor — which quietly meant anyone earning below the floor kept nothing extra from working. A 100% tax on the poorest, invisible when the net hangs low, brutal when it hangs high: at the higher rungs it destroyed a fifth to a quarter of all productive work, because why earn a dollar the top-up just takes back?
The fix is the same one real-world "earned income" programs use: taper the top-up instead of clawing it fully — let people keep part of what they earn as they climb off the floor. Same guarantee at zero income, but it preserved 22–28 more points of productive work and cost less, because people kept earning. That taper became the ratified design.
The one-line verdict
The floor is cheap insurance or a big program depending entirely on how high you hang it — so EDEN commits to the honest cost curve (self-funding while essentials stay under ~half a typical income) instead of a single number — and it hangs the net without a trapdoor, tapering the support so working your way up always pays.
Usual honesty: one behavioral knob (how much effort costs people), swept; no career changes or skill growth modeled; single 10-year horizon. It reconciles two prior models honestly rather than picking the flattering one. Run in the July 2026 program; plain-language companion added July 9, 2026.
Figures
Technical results
Built in response to the July 2026 verification, which found the program's two floor stories — the ABM's "self-funded at ≤2.2% of issuance" and the HANK/behavioral models' "37% take-up / 40% tax" — were claims about floors of ~10× different generosity (essentials ≈ 0.15× vs ≈ 0.8–1.2× median income), with behavioral take-up never fed back into the funding model. This model puts behavior and funding in one economy with one essentials definition (swept) and compares three floor designs. N=50k, 10 years monthly, v3 monetary engine (governor, routing, machine-pay, pool-then-topup funding), effort costs δᵢ ~ U(0, dmax·F) swept at dmax ∈ {0.15, 0.25, 0.40}.
The reconciliation: one cost curve
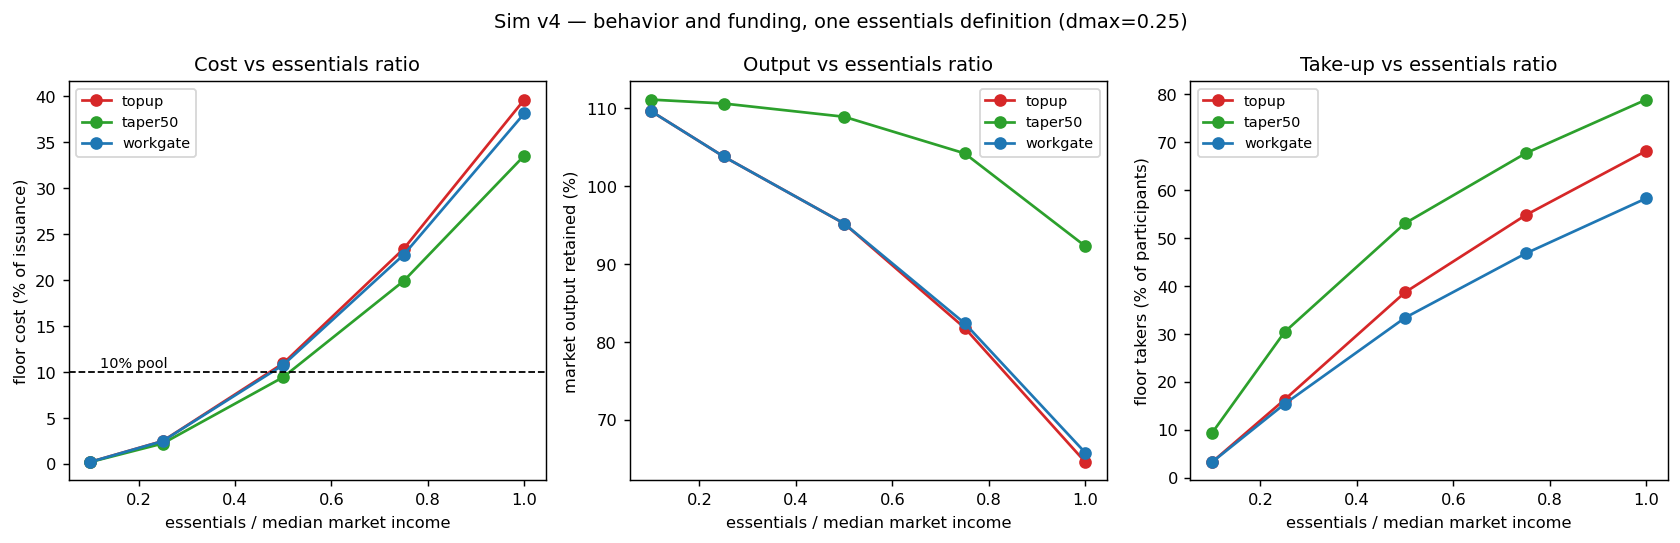
The two old claims were both right — about different points on one curve (dmax=0.25):
| essentials / median income | floor takers | market output retained | floor cost (% of issuance) | self-funded (10% pool)? |
|---|---|---|---|---|
| 0.10 (≈ v3's implied regime) | 3–9% | ~110% | 0.2% | ✅ |
| 0.25 | 15–30% | 104–111% | 2.2–2.5% | ✅ |
| 0.50 | 33–53% | 95–109% | 9.4–10.9% | ✅ (at the edge) |
| 0.75 | 47–68% | 82–104% | 20–23% | ❌ (top-up 7–15%) |
| 1.00 (≈ HANK's regime) | 58–79% | 65–92% | 34–40% | ❌ (top-up 24–34%) |
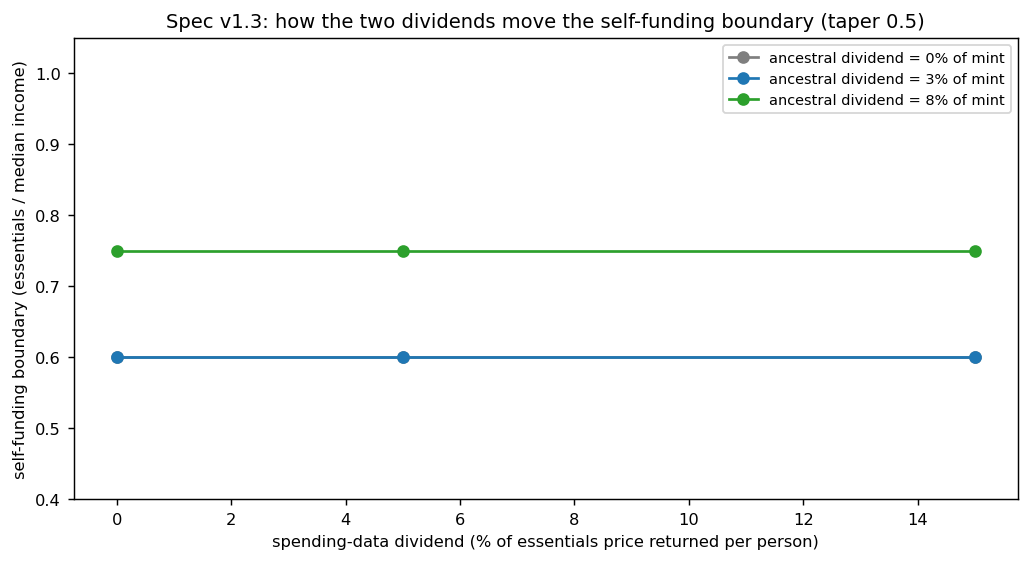
The self-funding boundary is essentials ≈ 0.5× median market income (all three designs, central effort costs). Below it, the ABM's story holds — the floor is cheap insurance. Above it, the HANK story holds — the floor is a major transfer program (the e=1.0 cost, 34–40% of issuance, independently reproduces HANK's corrected ~40% tax). Where the real EDEN would sit is unknowable pre-launch — it depends on what essentials actually cost relative to network incomes at scale — so the spec must carry the boundary, not a point claim. (Output figures share a benign ~+10% governor re-equilibration drift common to all cells; cross-design differences are the signal.)
The design finding: the v1.2 unconditional top-up has a cliff, and the taper fixes it
The v1.2 spec's floor (income = y + max(0, F − y)) is a 100% implicit marginal tax below F: anyone earning under F keeps nothing from contributing. Invisible at e=0.10; expensive at scale:
- At e=0.75: top-up design retains 81.8% of market output; the EITC-style taper (
topup = max(0, F − 0.5y)) retains 104.2% — a +22-point output gap for the same guarantee at zero income. - At e=1.00: 64.6% vs 92.3% (+28 points), and the taper is also cheaper (33.5% vs 39.6% of issuance) because low earners keep earning, so their top-ups are partial.
- The work-gated design (v1.0/v1.1) behaves like the top-up on output (same quit-the-market cliff at y<F), with the offset that floor-takers' verification work has unmodeled value.
Recommendation for spec v1.3: replace the unconditional top-up with the tapered guarantee — identical floor (F at zero income, criterion still mechanically satisfied: p10 ≥ 1.1× essentials in every cell), roughly half the output loss and lower cost above the boundary — and state the self-funding claim as: "pool-funded while essentials ≤ ~0.5× median network income at a 10% pool share; beyond that, external funding or a higher pool share is required."
Honest limits
Effort costs are the only behavioral parameter (swept 0.15–0.40×F; boundary stable at ~0.5 across the sweep — see JSON); no intensive margin (hours), no skill accumulation, no migration between creator/sharer roles; data demand scales with active sharers (conservative); quitting creators' engagement redistributes to remaining assets (consumers' hours don't vanish — this is why output can sit near 100% while take-up is high); the ~10% output drift artifact noted above; single 10-year horizon; N=50k single-seed (spot-checked stable across seeds at N=25k).
Files
integrated_behavioral_funding_sim.py, fig_v4_boundary.png, results_v4.json (full 45-cell sweep).
Raw data